Not Just a Developer
Is Renting Throwing Money Away?
A net worth evolution analysis of renting vs buying

Currently, I live in a shared rental apartment in Barcelona. Sharing a flat has its charm (and its challenges), but lately, a thought has been crossing my mind: what if I lived alone? Of course, that wouldn't come cheap—the rent would increase. So, being the curious mind that I am, I started wondering: would it be better to buy a home instead? That way, what is now an expense could turn into an investment…Right?
As I started digging into the topic, I found an abundance of opinions but a lack of solid numbers. On one hand, some claimed that renting was like “throwing money away.” On the other, there were those who argued that buying a house wasn’t a smart investment, as other assets could yield higher returns. Unsure of what to believe, I decided to run my own analysis.
After sharing this with a few friends and seeing they all found it very interesting, I decided to document it here. I hope you find it interesting too!
Introduction
Buying and maintaining a house comes with a long list of costs. However, the most significant one, and the focus of this study, is the opportunity cost.
After all, buying a house is, at its core, an investment. On one hand, it saves you the cost of rent. On the other, it ties up a large amount of money that could potentially be invested in higher-yield assets.
This analysis will focus on answering a single question: in the long run, which scenario leaves you with more wealth?
- Scenario A (buying): I buy a house with a mortgage and continue to invest my savings in stocks.
- Scenario B (renting): I don't buy a house, invest the down payment in stocks, and keep putting my savings into more stocks.
To simplify, I'll assume the mortgage is fixed-rate (though the results shouldn't vary significantly if it were variable).
The Simulation
To compare both scenarios (buying vs. renting), I created a simulation that tracks the evolution of a person's net worth in each case. The goal is to make it as realistic as possible: rent adjusts with inflation, salaries grow over time, investments yield returns (hopefully), and the value of the purchased property appreciates.
Throughout the analysis, we'll also explore how small variations in factors like rental prices or mortgage interest rates can alter the final outcome.
Expenses
Each scenario includes specific costs, in addition to the unavoidable "living expenses" (food, clothing, entertainment, and other earthly pleasures). For simplicity, we assume these common expenses increase annually by 2.5%, accounting for inflation and other factors.
In the case of renting, the only associated cost is the rent itself. Traditionally, rent increases have been linked to the Consumer Price Index (IPC in spanish). However, under the new Housing Law, adjustments are made using a similar index calculated by the INE (Spanish Statistics Institute), which we estimate at an annual rate of 2%.
On the other hand, the costs of purchasing a property can be divided into initial and recurring expenses. To estimate the initial costs, we assume the following:
- Notary, appraisal, property registration, and other fees: Approximately 10% of the property's value.
- Down payment: 20% of the property's price, with the remaining 80% financed through a mortgage.
To estimate monthly costs, we make the following assumptions:
- Mortgage payments: Calculated using the French amortization system.
- Property tax (IBI): Based on the "valor catastral" (an administrative value assigned to all Spanish properties by the Catastro), estimated to be 50% of the property's market value, with a rate of 0.66% annually in Barcelona.
- Maintenance: Estimated at 1% of the property's value per year. While this may vary, it's a conservative figure for properties in good condition.
- Homeowners' association fees: Fixed at €60 per month.
- Insurance: Estimated at 0.1% of the property's value per year.
- Waste tax and other fees: €100 annually.
A key detail is that all ownership-related costs (except the mortgage) are adjusted for inflation. This reflects reality, as taxes and other expenses tend to rise over time. Let’s see how expenses evolve in both cases (I’ve included some relevant output parameters in the legend):
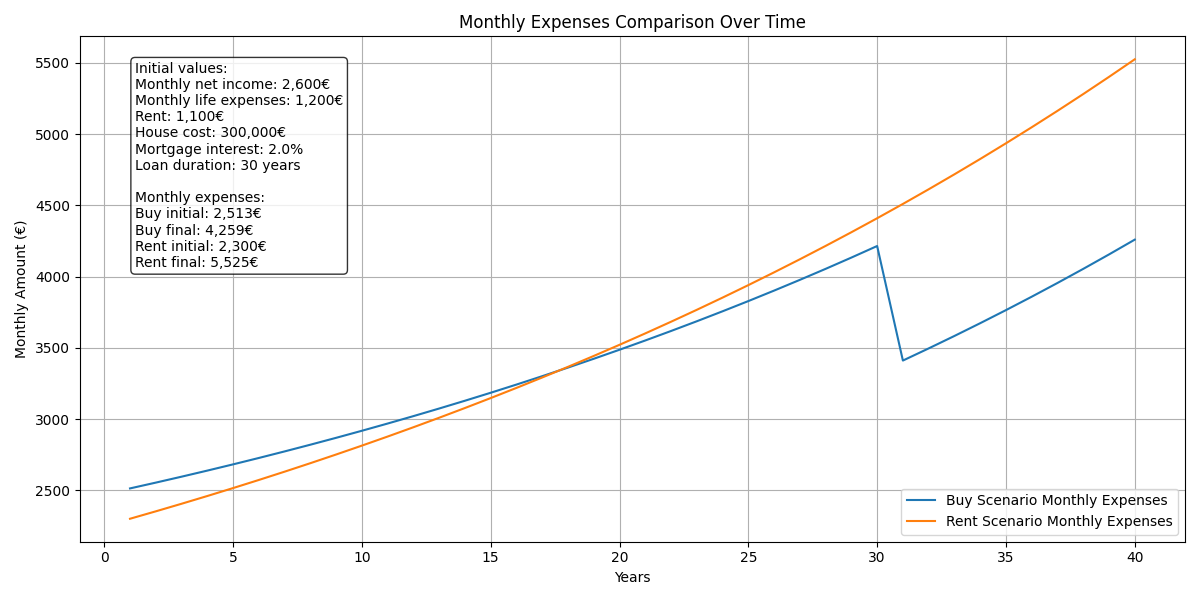
We can observe that expenses increase in both scenarios due to the rising cost of living. Additionally, there are two key points to highlight:
- At year 18: The savings margin for homeowners starts to surpass that of renters. This happens because rent adjusts annually for inflation, while mortgage payments remain constant.
- After the mortgage is paid off: Homeowner expenses drop dramatically, making it the clear winner in terms of long-term costs.
Income and Savings/Investment
Income is identical in both scenarios. We assume an initial net salary that grows at an annual rate of 3%, reflecting a reasonable increase in purchasing power over time.
Savings are calculated as the difference between income and expenses, and we assume all savings are fully invested in stocks month by month. This allows us to see how spending decisions directly impact our ability to generate long-term wealth.
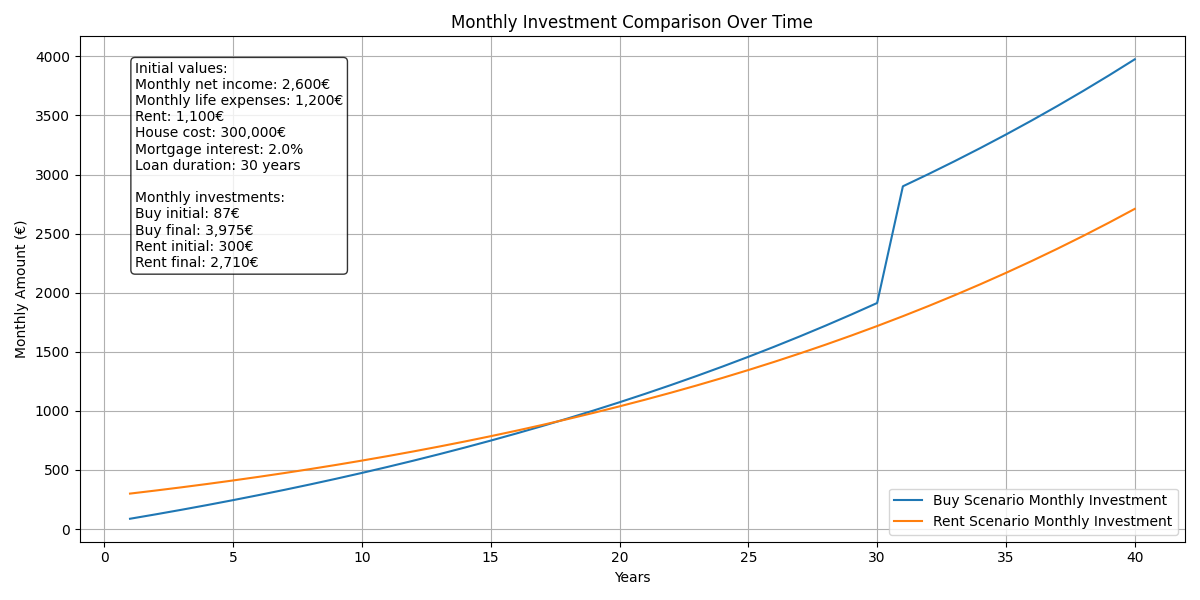
Since savings = investment = income - expenses, we can quickly identify this relationship in the graph. At year 18 of the mortgage, we would be investing more as homeowners compared to renters, and once the mortgage is paid off, we would enjoy a much higher savings margin.
Results
To evaluate the results, we’ll start by looking at the evolution of net worth in both cases, and then examine how some of the output parameters impact the final outcome. The output parameters chosen for this first simulation are values that seem reasonable to me. Let’s see what happens:
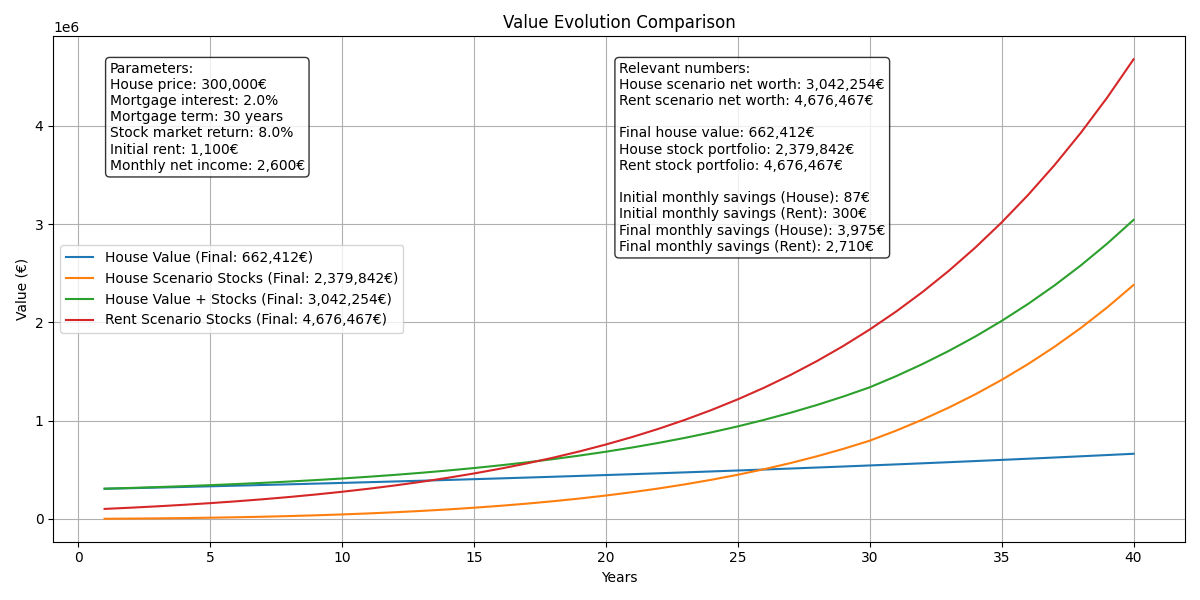
In a 40-year simulation, the renting scenario outperforms the buying scenario by over €1.5 million. Analyzing the early years, we can observe that at the start of the analysis (year 0), the homeowner’s net worth consists of the value of the purchased property (€300k) versus the €90k invested in stocks (the initial down payment for the property).
Over the years, thanks to monthly contributions and stock market appreciation, we see that by the 17th year of the mortgage, the total value of the stocks already surpasses the combined value of the house and stocks in the buying scenario.
In the end, the impact of compound interest is substantial. Starting with an initial investment of €90k in the stock market, the accumulated growth over 40 years is significant. Additionally, renting allows for greater investment capacity in the early years, which, over time, offsets the higher expenses associated with not owning a property.
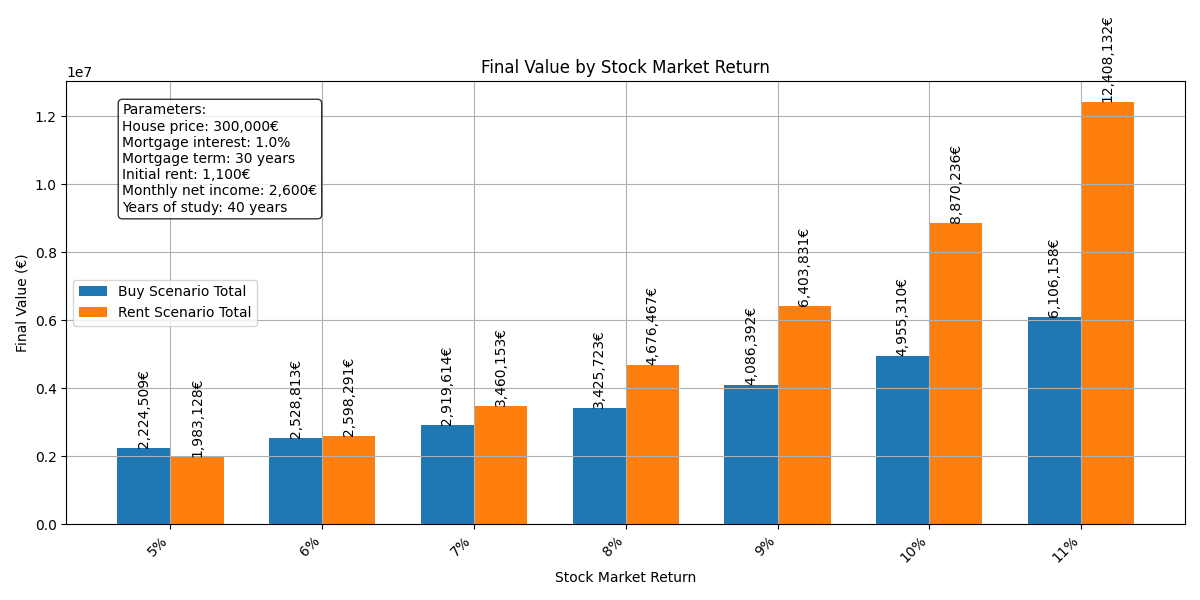
Stock Market Return
An 8% gross return (not accounting for inflation) has been assumed for the stock market. With portfolios containing higher-volatility assets (higher beta), returns of 10–11% are possible, although this would require strategic timing for entering and exiting the market.
An 8% return seems reasonable to me, but I understand that some might consider it overly optimistic. So, how would this rate influence the final outcome? Let's see:
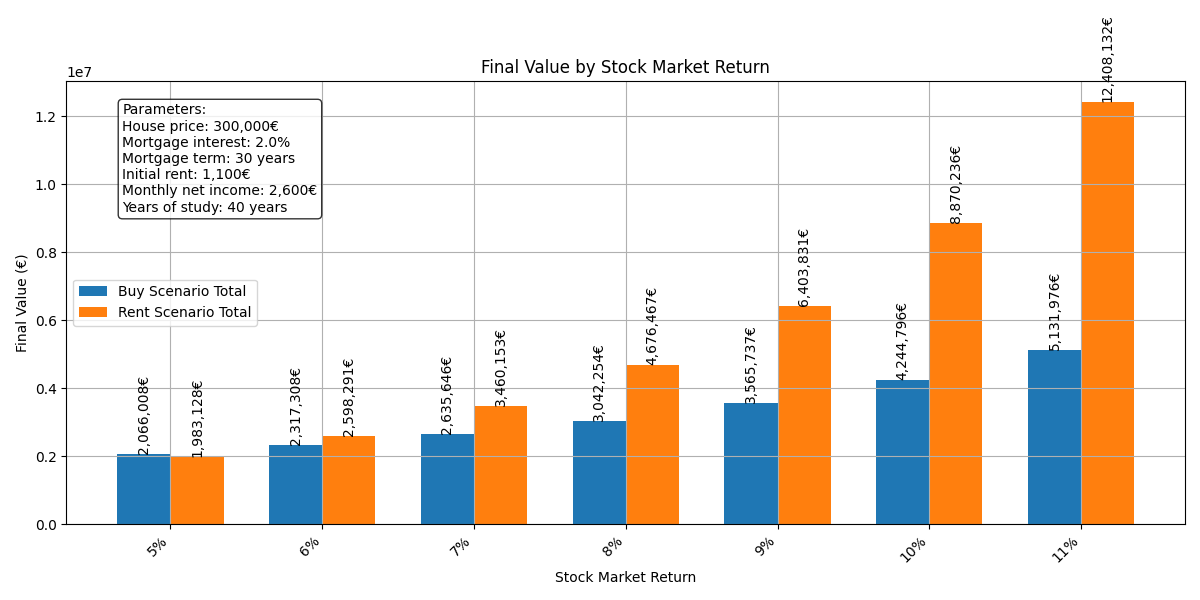
With a 5% return, buying a property becomes more attractive. However, beyond that point, renting becomes the superior option, with the difference growing as the stock market return increases.
If we run the simulation with a mortgage at 1%, we wouldn’t see much of a difference:
Mortgage Interest
Mortgage interest is also an important variable. It’s the cost of the money we are borrowing, so let’s see how it affects the final result:
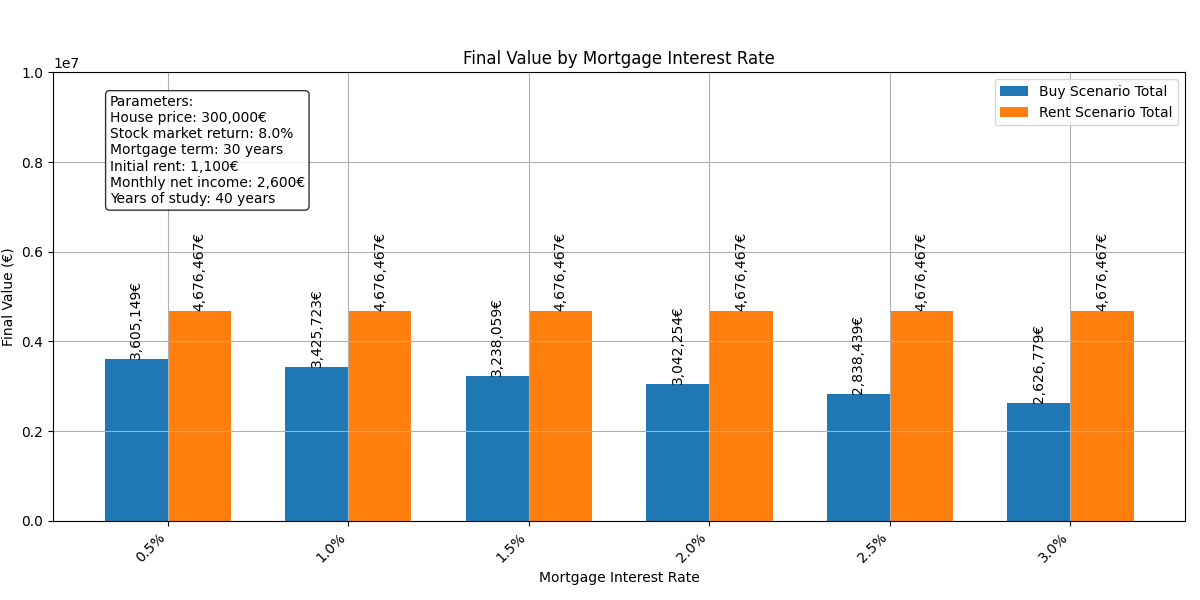
With a lower interest rate, we achieve greater net worth in the long run. This happens because a lower interest rate results in lower monthly payments, which in turn creates a greater savings margin. This additional margin can be invested in more financial assets, thereby increasing the overall net worth.
Let’s see what happens if we achieve a 6% return in the financial market:
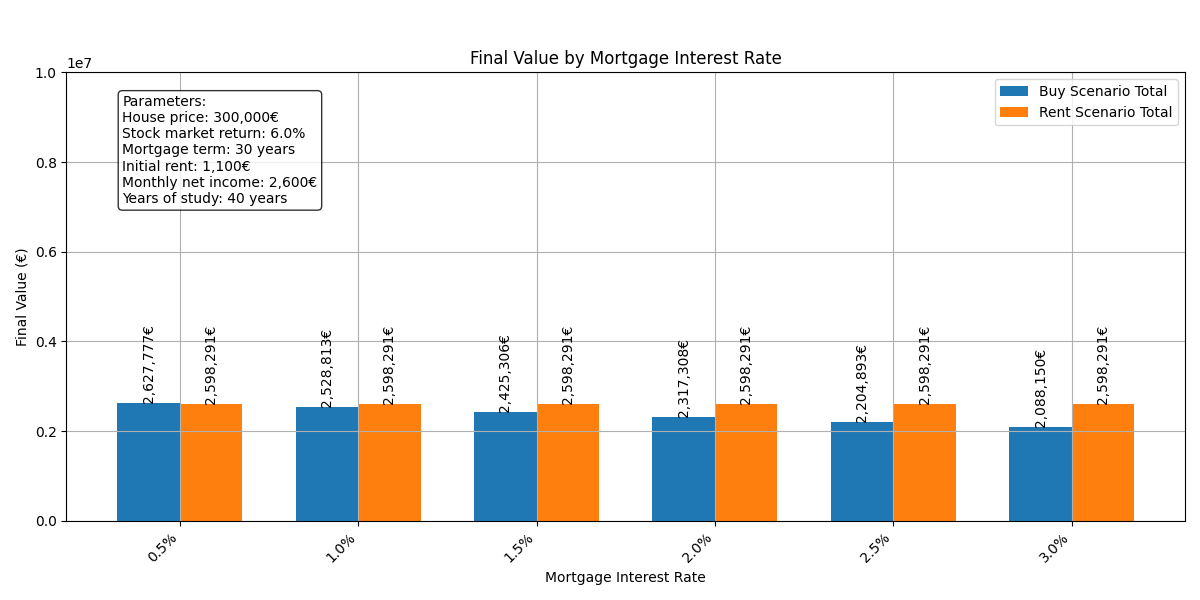
According to these results, buying a property would only be profitable if we manage to secure an interest rate lower than 1%.
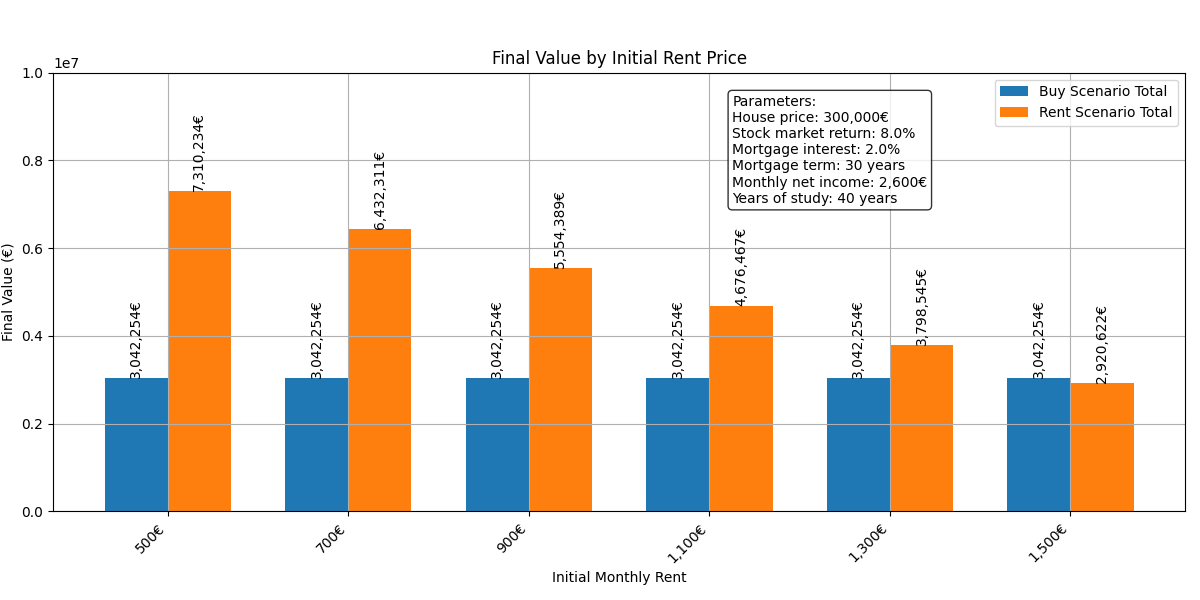
Rent Price
The price of rent is another crucial factor in this analysis. So far, we’ve assumed a monthly rent of €1,100, which is what I estimate it costs to rent a decent apartment for one person in Barcelona in 2023.
This rent is consistent with the average return of a property in Barcelona, which is approximately 4.8% (according to data from the Housfy platform in 2023). If we use this return in the gross profitability formula, we see that rent for a €300k property would be around €1,200 per month.
There are many variations in this value depending on the circumstances. For instance, if you live with a partner, you could rent a nice apartment for €1,800, which would result in a cost of €900 per person. Or perhaps you are sharing an apartment and renting a room for €500, which seems like a much more economical option compared to living alone in a purchased home.
Let’s see the impact of rent:
Conclusion
Renting is not throwing your money away
This study has been an eye-opener, as I did not expect to find such a significant difference between buying and renting under certain conditions. Many people believe, more out of sentiment than reasoning, that renting is “throwing money away.” However, when you run the numbers, the reality can be quite different.
For instance, if we consider purchasing a property for €300,000 with a 2% interest rate, the cost of the mortgage could exceed €100,000 just in interest (now that is throwing money away). On top of that, there are additional expenses associated with owning a home, such as maintenance and insurance, which in this example would amount to around €3,000 annually.
Another factor I haven’t included in this analysis is the time required to save enough for a down payment. This time factor can make buying a house even less attractive from a financial standpoint. While saving for the down payment, that money could instead be invested in the stock market, potentially generating returns that further widen the gap between buying and renting.
Why I still want to own a house
This research has helped me realize that renting is not throwing money away. Even so, it’s important to recognize that, in the end, all the graphs and numbers presented here are just data—and unfortunately, numbers alone do not make us happy.
Although it may not be the best financial decision, I would still eventually like to own my own home. Buying a house has a significant emotional component that goes beyond financial analysis. Having a place you can truly call home, where no one can evict you, and that you can customize to your liking, provides a sense of stability and satisfaction that is hard to measure in euros.
What I have realized though, is that buying a house in your twenties might not be the best decision. At that age, your life circumstances are likely to change significantly as you grow older, career changes, relationships, or different lifestyle preferences might lead you to eventually rent out that first property to buy a different one. If you're going to end up being a landlord anyway, it might be wiser to wait: focus first on building wealth through other assets, maximize your savings, and later purchase a home you truly plan to settle in.
Additionally, if you already have some level of wealth, investing in property can be an interesting way to diversify your assets, adding a tangible and stable element to your portfolio. Moreover, if you don’t need to take out a mortgage, it can become an even more attractive investment.
What about cash flow?
This study has focused solely on net worth evolution, but after discussing these results with friends, I realized there's another crucial perspective we haven't explored: cash flow. While net worth is important for long-term wealth building, your monthly cash flow directly impacts your quality of life today. In the future, I plan to conduct a separate analysis focusing on cash flow patterns in both scenarios.
Appendix: Script Code
Below I add some code that calculates the evolution of the net worth in both scenarios. For the full code, you can check out the GitHub repository.
    def calculate_value_evolution(
        self, params: AnalysisParams = None
    ) -> Tuple[
        List[float], List[float], List[float], List[float], List[float], List[float], List[float], List[float], dict
    ]:
        if params is None:
            params = self.params

        down_payment, appraisal_notary = self._calculate_initial_payments(params.house_price)
        initial_payment_total = down_payment + appraisal_notary
        monthly_ownership_costs = self._calculate_monthly_costs(params.house_price)
        monthly_morgage_payment = self._calculate_monthly_payment(
            params.house_price, down_payment, params.mortgage_term
        )

        # Initialize tracking variables
        monthly_income = params.monthly_net_income
        monthly_expenses = params.initial_monthly_expenses
        house_value = params.house_price
        rent_price = params.initial_rent_price

        # Scenario 1: House purchase
        house_stock_portfolio = 0

        # Scenario 2: Rent only
        rent_stock_portfolio = initial_payment_total

        rent_stock_portfolio_initial = initial_payment_total

        house_values = []
        house_stock_values = []
        rent_stock_values = []

        # Lists to track yearly values
        year_month_house_savings = []
        year_month_rent_savings = []
        year_month_house_expenses = []
        year_month_rent_expenses = []

        for i in range(params.years_of_study):
            # Calculate monthly values once per year since they stay constant
            disposable_income = monthly_income - monthly_expenses

            # Calculate yearly savings for house scenario
            if i < params.mortgage_term:
                house_monthly_costs = monthly_morgage_payment + monthly_ownership_costs
            else:
                house_monthly_costs = monthly_ownership_costs
            house_savings = disposable_income - house_monthly_costs
            year_month_house_savings.append(house_savings)

            # Calculate yearly savings for rent scenario
            rent_savings = disposable_income - rent_price
            year_month_rent_savings.append(rent_savings)

            year_month_house_expenses.append(house_monthly_costs + monthly_expenses)
            year_month_rent_expenses.append(rent_price + monthly_expenses)

            for j in range(12):
                # Update stock portfolios using pre-calculated values
                house_stock_portfolio += house_savings
                rent_stock_portfolio += rent_savings

                # Apply monthly stock market returns
                house_stock_portfolio *= 1 + params.stock_market_return / 12
                rent_stock_portfolio *= 1 + params.stock_market_return / 12

                rent_stock_portfolio_initial *= 1 + params.stock_market_return / 12
            # Yearly updates
            monthly_income *= 1 + params.annual_income_increase_percentage
            monthly_expenses *= 1 + params.annual_expenses_increase_percentage
            monthly_ownership_costs *= 1 + params.annual_expenses_increase_percentage
            house_value *= 1 + self.config.annual_house_appreciation
            rent_price *= 1 + self.config.annual_rent_increase

            house_values.append(house_value)
            house_stock_values.append(house_stock_portfolio)
            rent_stock_values.append(rent_stock_portfolio)

            # Calculate combined values (house + stock portfolio)
            combined_values = [h + s for h, s in zip(house_values, house_stock_values)]

        # Calculate final net worth for both scenarios
        house_final_worth = house_values[-1] + house_stock_portfolio
        rent_final_worth = rent_stock_values[-1]

        return ...
Example of graph generation using the previous class method:
plt.figure(figsize=(12, 6))
(
    house_values,
    house_stock_values,
    combined_values,
    rent_stock_values,
    yearly_house_savings,
    yearly_rent_savings,
    yearly_house_expenses,
    yearly_rent_expenses,
    financial_details,
) = analysis.calculate_value_evolution()

# Plot all value series
plt.plot(years, house_values, label=f"House Value (Final: {house_values[-1]:,.0f}€)", color="gray")
plt.plot(
    years, house_stock_values, label=f"Buy Scenario Stocks (Final: {house_stock_values[-1]:,.0f}€)", color="lightblue"
)
plt.plot(years, combined_values, label=f"Buy Total (Final: {combined_values[-1]:,.0f}€)", color="blue")
plt.plot(years, rent_stock_values, label=f"Rent Total (Final: {rent_stock_values[-1]:,.0f}€)", color="orange")